
Seeing qubits: the Bloch-sphere viewer#
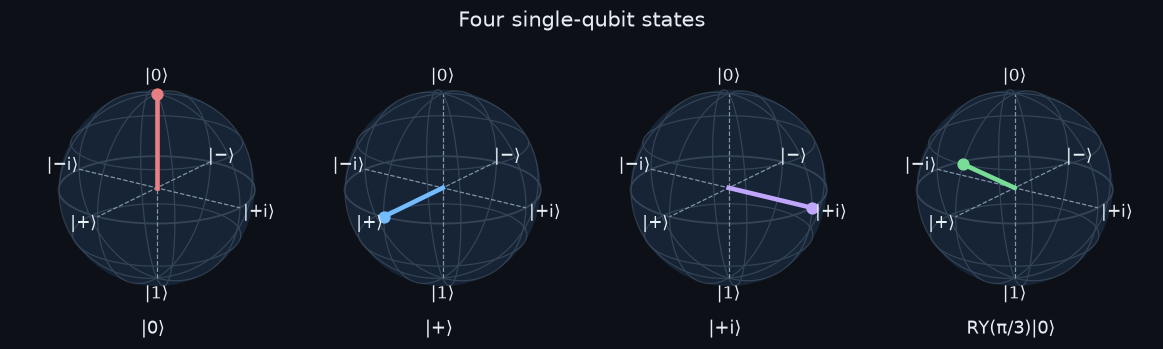
Every qubit state can be drawn as a point on (or inside) a sphere. The viewer turns circuits, beliefs and rotations into Bloch-sphere pictures and animations: static Matplotlib figures for papers and interactive Plotly figures for the web. This tutorial follows a two-qubit circuit gate by gate, shows what entanglement does to the Bloch vectors, and animates it.
import numpy as np
import matplotlib.pyplot as plt
from qiskit import QuantumCircuit
from quantum_mind.viz import (use_mpl_style, plot_bloch, circuit_trajectory, plot_entanglement,
                              entanglement_summary, bloch_vectors)
theme = use_mpl_style('dark')
1. Single-qubit states#
states = {'|0⟩': [1, 0], '|+⟩': [1, 1], '|+i⟩': [1, 1j], 'RY(π/3)|0⟩': [np.cos(np.pi / 6), np.sin(np.pi / 6)]}
for name, v in states.items():
    v = np.array(v, complex) / np.linalg.norm(v)
    print('%-12s Bloch vector %s' % (name, np.round(bloch_vectors(v)[0], 3)))
fig, spheres = plot_bloch(np.array([bloch_vectors(np.array(v, complex) / np.linalg.norm(v))[0] for v in states.values()]),
                          names=list(states), title='Four single-qubit states', size=2.6)
plt.show()
|0⟩          Bloch vector [0. 0. 1.]
|+⟩          Bloch vector [1. 0. 0.]
|+i⟩         Bloch vector [0. 1. 0.]
RY(π/3)|0⟩   Bloch vector [0.866 0.    0.5  ]
2. A circuit, gate by gate#
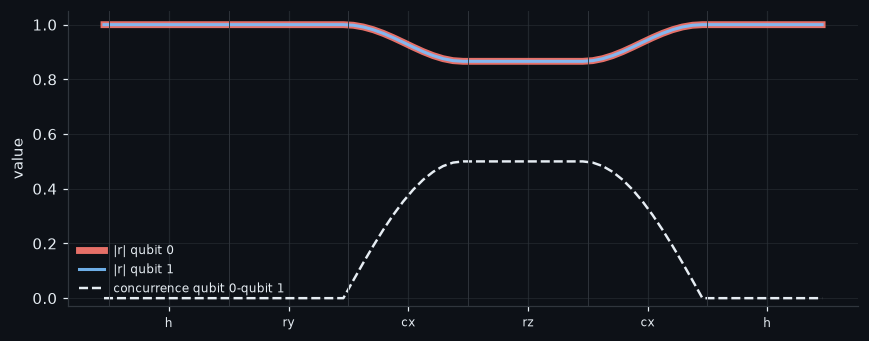
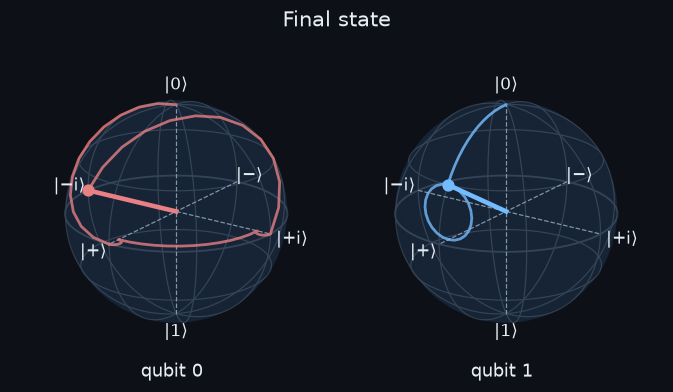
While the qubits are entangled their Bloch vectors shrink inside the sphere: each qubit on its own is in a mixed state. Concurrence measures the entanglement. This circuit entangles the qubits and then undoes it, so both vectors are back on the surface at the end.
qc = QuantumCircuit(2)
qc.h(0); qc.ry(np.pi / 3, 1); qc.cx(0, 1); qc.rz(np.pi / 2, 0); qc.cx(0, 1); qc.h(0)
print(qc.draw(output='text'))
traj = circuit_trajectory(qc, steps=12)
traj.names = ['qubit 0', 'qubit 1']
from qiskit.quantum_info import Statevector
ent = entanglement_summary(Statevector(qc))
print({k: np.round(v, 3) for k, v in ent.items()})
        ┌───┐        ┌─────────┐     ┌───┐
q_0: ───┤ H ├─────■──┤ Rz(π/2) ├──■──┤ H ├
     ┌──┴───┴──┐┌─┴─┐└─────────┘┌─┴─┐└───┘
q_1: ┤ Ry(π/3) ├┤ X ├───────────┤ X ├─────
     └─────────┘└───┘           └───┘
{'bloch_length': array([1., 1.]), 'concurrence': array([[0., 0.],
       [0., 0.]])}
fig = plot_entanglement(traj)
plt.show()
fig, spheres = plot_bloch(traj.vectors[-1], names=traj.names, title='Final state', size=3.0)
for s, k, c in zip(spheres, range(2), theme['palette'][:2]):
    s.add_trajectory(traj.vectors[:, k, :], color=c)
plt.show()
3. Interactive animation#
Drag to rotate, press play or use the slider (needs plotly).
try:
    from quantum_mind.viz import animate_bloch
    fig = animate_bloch(traj, title='H · RY(π/3) · CNOT · RZ(π/2) · CNOT · H', height=460)
    fig.show()
except ImportError:
    print('install "quantum-mind[viz]" for interactive figures')
The same functions draw beliefs from the quantum-like models (belief_trajectory, tutorial 3) and
states measured on hardware (bloch_tomography).
References: Nielsen & Chuang (2010), section 1.2; Wootters (1998), Physical Review Letters 80, 2245 (concurrence).