
Bloch-sphere viewer (quantum_mind.viz)#
See qubits move in 3D: gate by gate through any Qiskit circuit, event by event through a quantum-like trust model, or as measured on a simulator or quantum hardware.
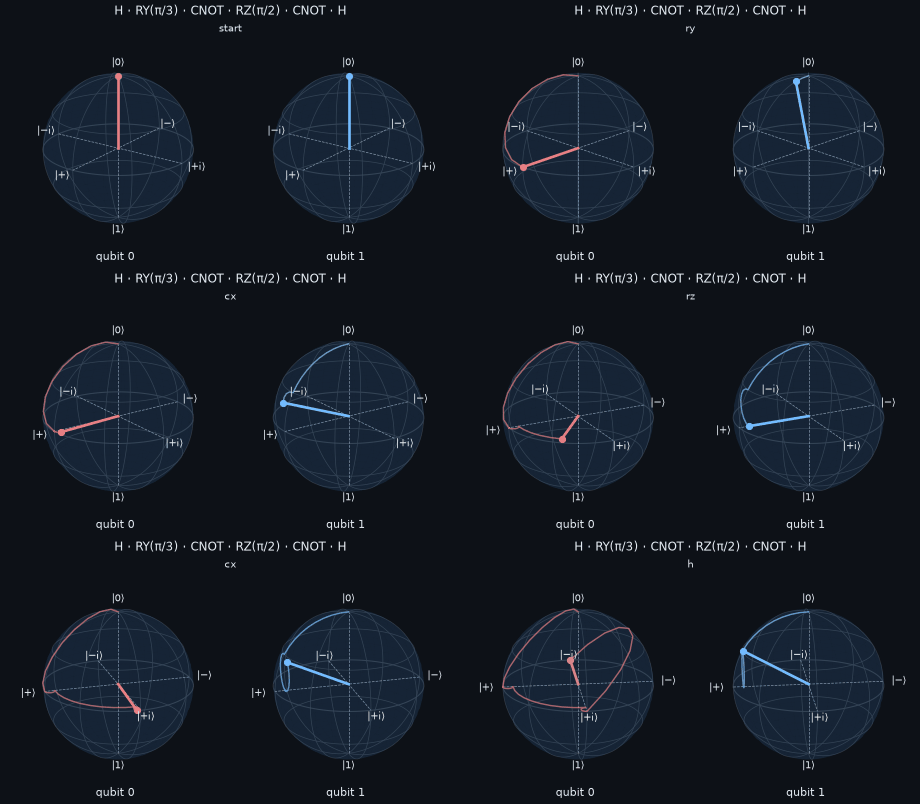
Function |
Output |
Needs |
|---|---|---|
|
Bloch vectors of one qubit or every qubit (reduced states of entangled qubits lie inside the ball) |
NumPy |
|
|
Qiskit |
|
|
NumPy |
|
Bloch vectors estimated from X, Y, Z measurements on |
Qiskit (+ backend) |
|
Static Matplotlib figure; add vectors, points, trajectories |
Matplotlib |
|
Matplotlib animation; GIF (Pillow) or MP4 (ffmpeg); optional camera rotation |
Matplotlib |
|
Interactive Plotly figure (rotate, zoom, hover) |
Plotly |
|
Interactive animation with play/pause and a labelled slider; standalone HTML |
Plotly |
|
Real-time spheres: a Plotly |
Plotly + ipywidgets + anywidget, or Matplotlib |
|
Pairwise entanglement (Wootters concurrence; checked against Qiskit) and Bloch-vector lengths |
NumPy |
|
Timeline of Bloch lengths and concurrence along a circuit, labelled by gate |
Matplotlib |
|
Q-sphere of a multi-qubit state (Qiskit’s |
Qiskit, Matplotlib, seaborn |
from qiskit import QuantumCircuit
from quantum_mind.viz import circuit_trajectory, animate_bloch, save_html, animate_trajectory, LiveBloch

qc = QuantumCircuit(2); qc.h(0); qc.cx(0, 1); qc.ry(0.6, 1)
traj = circuit_trajectory(qc, steps=15)
save_html(animate_bloch(traj, title='Bell state'), 'bell.html')     # open in a browser
animate_trajectory(traj, save='bell.gif', rotate=0.5)              # for slides and READMEs

live = LiveBloch(2).show()          # Jupyter: an interactive widget that updates in place
live.play(traj, fps=30)             # or call live.update(state) inside a simulation loop
Themes. theme='dark' (default, GitHub dark palette) or 'light', or a dict with the keys of
quantum_mind.viz.THEMES['dark'].
Conventions. Qiskit qubit order (qubit q is bit q of the basis index); |0⟩ at the north pole, |+⟩ on +x, |+i⟩ on +y. In the trust model, the north pole means “yes, I trust the robot”.
Relation to Qiskit’s own plots. qiskit.visualization.plot_bloch_multivector draws one static
state. quantum_mind.viz adds trajectories through a circuit, animation, interactive HTML, live updating and
tomography from real backends; it accepts Qiskit Statevector and DensityMatrix objects directly.